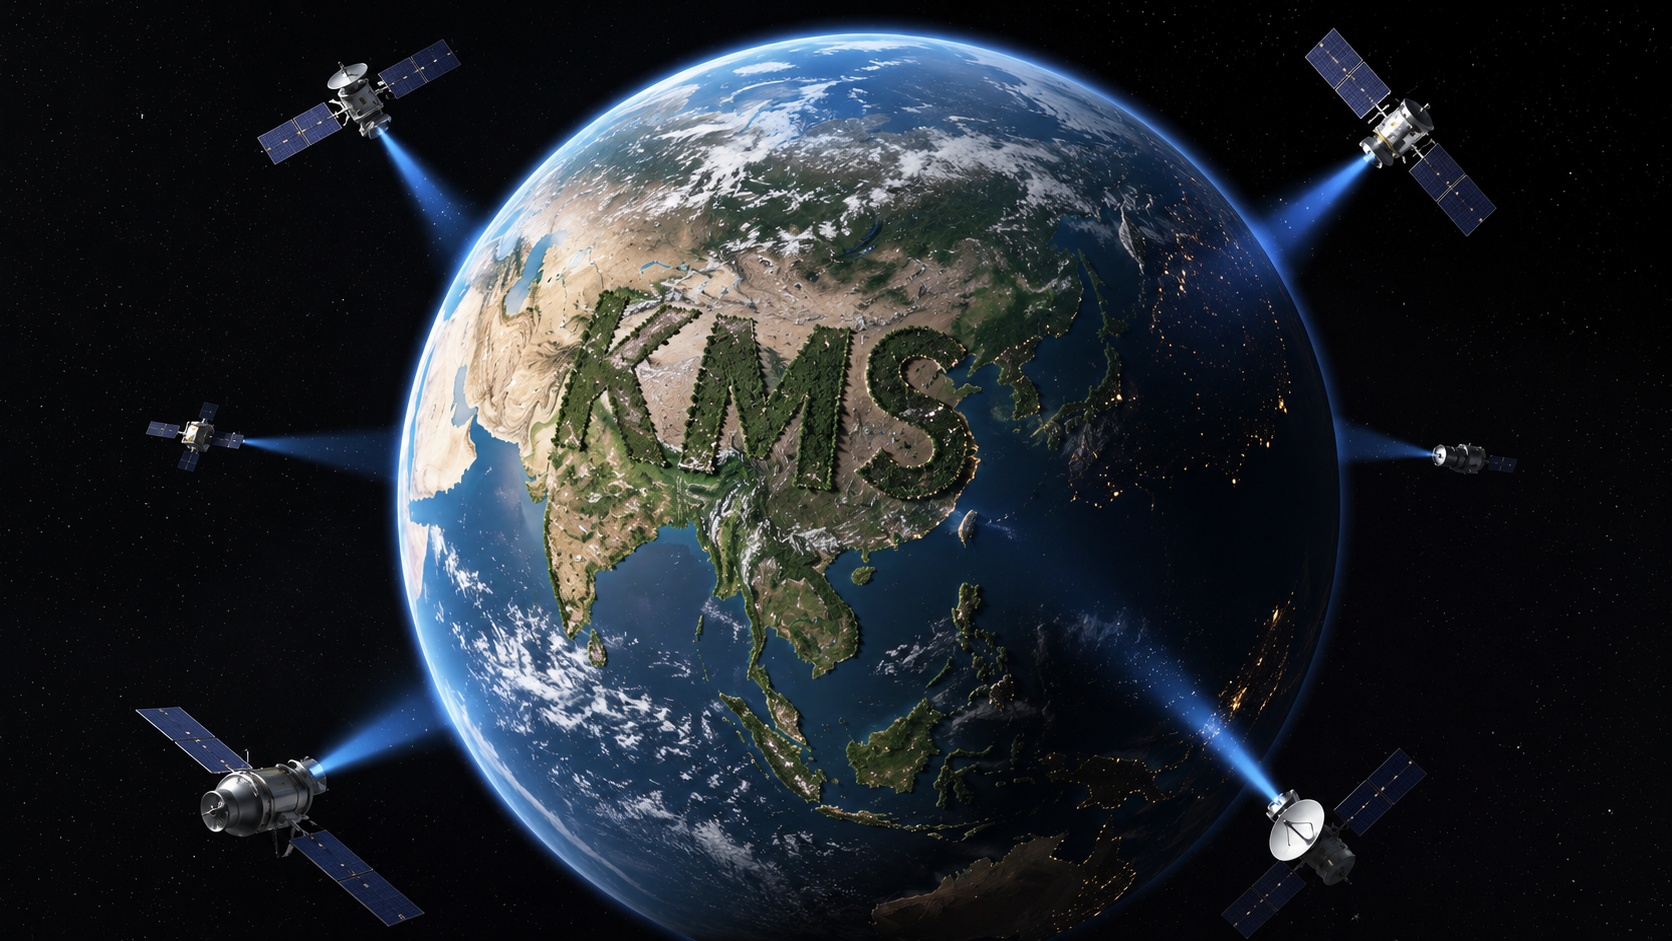
We have the industry best talent and high quality infrastructure to deliver best in class services in RS and GIS domain. Each workstation is powered by dual high end Intel Xeon Gold processors with RAM of 256 GB and above. Our infrastructure includes high end 4K resolution monitors to enhance the quality of work and deliverables. Our technical teams work with leading GIS, remote sensing and cloud based geospatial platforms and can use tools such as Google Earth Engine where appropriate for the project scope and client needs. Contact us today to get a proposal for services related RS and GIS in any part of the World.
Our service offerings are expanded and enhanced on a constant basis. Some of the services and solutions in Remote Sensing and GIS domain include:
- Land Use and Land Cover classification for REDD+ forestry projects
- Land Change Modelling.
- Coastal Ecosystem Monitoring and Management.
- Forestry Mapping.
- Agricultural & Irrigation Mapping.
- Minerals, Mining and Geology Mapping.
- Environmental Impact Assessment.
- Watershed Management.
- Flood Mapping and Risk assessment.
- Climate Change Modelling.
- Disease Mapping, Forecasting and Risk Assessment.
- Habitat and Biodiversity Modelling (HBM).
- Habitat Assessments.
- Habitat Change/Gap Analysis.
- Species Range Assessment.
- Habitat Suitability.
- Corridor Planning.
- Species Distribution Modelling with Maximum Entropy and R.
- Landscape Planning and Analysis.
- Biodiversity database development
- Terrain analysis
- Geo-statistical Analysis
- Open Data Kit (ODK) & Geo-ODK
- Data conversion
Some of our work case studies are given below:
- Forest loss in various countries.
- Forecasting Malaria spread in future.
- Spatial delineation of effectiveness of protected areas using geospatial technologies.
- Monitoring Urban Heat Island (UHI) with Landsat Data.
- Mapping and monitoring vegetation burn severity using Remote Sensing data.
How remote sensing and GIS powers a carbon project
Most of the carbon work KMS does runs on this capability underneath it. A REDD+ baseline needs land use and land cover classification and change detection to prove deforestation rates. A forest carbon survey needs remote sensing to extend field plots across the whole project area. A biodiversity or habitat assessment needs spatial modelling to map condition and connectivity. The geospatial work is not a side service. It is the measurement layer the carbon and the safeguards rest on.
That is why the same team handles land change modelling, forestry and habitat mapping, terrain and geostatistical analysis and field data collection through ODK. Whether the output is a REDD+ baseline, an AFOLU map, the environmental baseline behind a socio-economic assessment or a monitoring system for a live project, it comes from the same place: satellite and field data, analysed properly, turned into something a verifier will accept. The same capability also underpins our natural resource management work, and the wider picture sits in our carbon credit knowledge hub.
Frequently asked questions
How is remote sensing used in carbon projects?
Remote sensing maps land and measures change from satellite or aerial imagery. In carbon projects it classifies land use and land cover, detects deforestation and land use change over time and extends field measurements across an entire project area. It is how a REDD+ or forestry project proves its baseline and monitors results.
What is land use and land cover (LULC) classification?
LULC classification sorts the land in satellite imagery into categories like forest, cropland, water and built up area. Comparing LULC maps across dates shows how land has changed. For REDD+ and AFOLU projects this is the core method for measuring deforestation and proving a credible baseline.
What remote sensing and GIS services does KMS provide?
KMS covers LULC classification for REDD+, land change modelling, forestry and coastal mapping, habitat and biodiversity modelling, flood and disease mapping, terrain and geostatistical analysis and field data collection through ODK. The work runs on high performance infrastructure and platforms including the likes of Google Earth Engine.
Can KMS use Google Earth Engine for remote sensing projects?
Yes. KMS can use Google Earth Engine and other GIS or remote sensing platforms where they are suitable for the project. Platform selection depends on the project scope, data requirements, licensing terms, processing needs and client preferences. For commercial projects, any third party platform costs or licensing requirements can be reviewed during scoping. For carbon projects, this supports the spatial evidence needed to establish baselines, monitor land use change and document project outcomes over time.
How does GIS support REDD+ and forestry projects?
GIS brings the spatial data together: land cover, change over time, project boundaries and field measurements in one analysis. For REDD+ and forestry carbon projects that is what produces the baseline, the deforestation rate and the monitoring a verifier checks against. Without it the carbon claim has no spatial proof.
Talk to a KMS carbon consultant
Need remote sensing or GIS for a carbon, forestry or land use project, a REDD+ baseline, an AFOLU map or a monitoring system? Tell us what you are mapping and we will scope it.
Add Comment